Quant Trading Returns in Crypto: Does the 40% Target Hold Up When the Timeline Problem Is Applied?
This podcast debate transcript accompanies the pillar article on how quantitative systems engineer consistent returns in cryptocurrency markets. The counterarguments examined here are the ones the article’s performance case doesn’t confront directly: that 470 days of enduring drawdown is a psychological reality most investors cannot sustain, that statistical significance requires far more trading history than most retail participants allow for. The podcast debate also explores leverage invariance — the most practically important concept in the series — which is also consistently overlooked.
⚡Listen to the 02 Podcast on Spotify
Podcast Episode: Cluster-02 – The Mathematics of Systematic Trading
Duration: ~18 minutes
Published: February 2026
Topic: Why top quant funds consistently achieve 40%+ returns while retail traders trend toward zero
📻 About This Podcast
This podcast was generated using Google’s NotebookLM from the research in this article. The conversational debate format explores the concepts from multiple perspectives—examining both advantages and potential concerns—which can help clarify complex ideas that might be dense in written form.
This is a supplementary tool. The article contains the full technical analysis and primary sources. The podcast is for those who prefer audio learning or want to hear counterarguments explored through discussion.
“The pillar article on quant trading returns in crypto covers the full mathematical framework behind the 40% target — including Monte Carlo simulations, volatility targeting, and the Sharpe ratio benchmarks the podcast debate is built around.”
📖 Read the Full Article 02: Why Crypto Trading With Hedge Funds Returns 40%+ While Retail Traders Struggle: The Math They Don’t Want You to Know
⚡ What This Debate Revealed That the Article Didn’t Cover
The article makes the mathematical case for systematic trading. The debate surfaces three challenges that the systematic model doesn’t fully answer — and that every retail investor considering this approach should sit with:
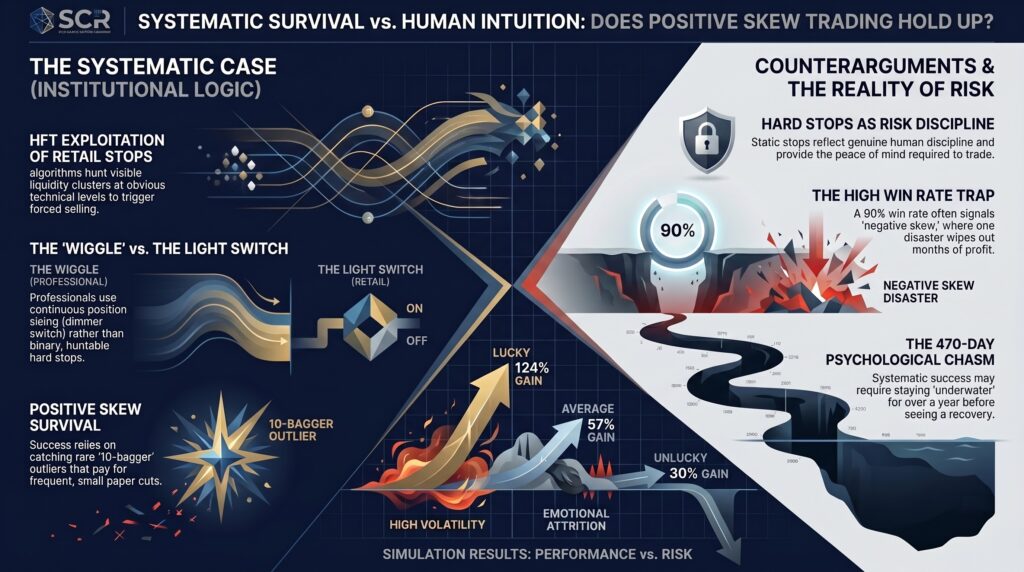
- The 470-day drawdown scenario is psychologically brutal in a way the math doesn’t capture. Monte Carlo simulations at 50% volatility target produce a worst-case 53% drawdown lasting 470 days. The Expert’s reaction — “you expect me to sit underwater for a year and a half?” — is not irrational. The debate acknowledges this honestly: if you can’t psychologically endure institutional-level boredom, systematic trading will torture you regardless of how good the math is.
- The timeline problem means 2 months of data is genuinely meaningless. Even with a true 1.5 Sharpe system, there’s a 42% chance you’re in the red after 50 trading days. Most retail traders quit at exactly the point where the system hasn’t yet had enough trades to demonstrate its edge. The quants know this and hold through it — retail doesn’t.
- Leverage invariance is counterintuitive and most retail investors never learn it. The Expert’s instinct — “40% return is better than 20% return, obviously” — is the near-universal retail mistake. The debate’s explanation of why a 2.0 Sharpe at 20% return beats a 1.0 Sharpe at 40% return (via safe leverage application) is the single most practically useful insight in all eight episodes.
🧠 SCR Analysis: Where the Debate Lands
The Expert’s journey in this episode mirrors the journey most serious retail investors take when they first encounter systematic methodology. The “green is green” opening position — dismissing risk-adjusted metrics in favour of raw returns — is not stupidity, it’s the natural starting point for anyone who hasn’t been exposed to how professional capital allocation actually works. The debate earns its conclusion by working through that journey honestly rather than just asserting the answer.
The 470-day drawdown number is the most important data point in the episode — not because it should frighten investors away, but because it’s the honest filter. If that number makes you want to exit, you are not the right investor for this strategy at the 50% volatility tier. The 25% volatility target exists precisely for investors who understand the math but need to stay psychologically in the game. Starting conservative and letting the math prove itself is not weakness — it’s appropriate position sizing.
The SCR verdict: The thesis holds completely. The gap between 40% hedge fund returns and zero retail returns is not information asymmetry — it’s mathematical discipline applied consistently over the correct time horizon. The six-signal blend, the Kelly-based volatility targeting, and the 400-day evaluation window are not sophisticated tricks; they are the minimum viable framework for surviving the variance long enough to capture the drift. The single most actionable takeaway from this episode: never evaluate a systematic strategy on less than 12 months of live data.
Episode Summary
This episode examines the performance gap between top-tier quantitative hedge funds and struggling retail traders in cryptocurrency markets. The central thesis argues that professional success is not driven by insider information, but by a systematic mathematical approach prioritizing the Sharpe ratio—risk-adjusted returns—over raw profit figures. By utilizing leverage-invariant performance and a blend of six uncorrelated signals, quants create smoother equity curves that allow them to survive market “noise” and avoid the emotional traps of “number goes up” mentality. The discussion serves as a technical primer on volatility targeting and the timeline problem, warning that even a winning system requires the discipline to endure hundreds of days of variance to capture long-term statistical drift.
Full Transcript
Host: Welcome to the debate. Today, we’re dissecting a statistical anomaly that honestly should keep every retail trader up at night. We’re looking at a specific glaring disparity in the crypto markets. Why is it that top-tier quantitative hedge funds average, you know, 40% plus annual returns year-over-year, no matter what the market is doing, right? While retail traders who are trading the same assets, Bitcoin, Ethereum, and Solana, statistically just trend toward zero.
Expert: It’s the big question, isn’t it? I mean, it drives the entire industry. Though, you know, depending on who you ask on Twitter, the answer is always manipulation or whales or just bad luck.
Host: Well, that’s the comfortable answer, right? It kind of absolves the trader of any responsibility. But the uncomfortable truth we’re tackling today, and this is drawn from some deep dive systematic research, is that the difference isn’t insider info. It’s not about better connections. It’s not some secret Telegram group where they decide the price of Bitcoin. It is a fundamental difference in how professionals process chaos versus how retail traders do. It really just comes down to systematic mathematics.
Expert: Okay, I have to jump in right there because I know the stance you’re going to take. You represent the Trader Army, right? The physics PhDs, the guys who look at a chart and see a differential equation. I’m coming at this as someone who’s actually been in the trenches. I mean, I’ve traded the bull runs. I’ve survived the crypto winters. I rely on intuition, on the feel of the market. And frankly, I’m pretty skeptical when someone tells me a black box algorithm is going to outperform my ability to read the tape during a mania.
Host: And I appreciate that scepticism. It’s healthy. In fact, scepticism is the first step of the scientific method. But my goal today is to show you that your intuition is, well, it’s often mathematically misaligned with reality. We’re going to talk about the Sharpe ratio, the timeline problem, and the specific architecture of strategies like HyperTrend. We operate on the philosophy of “research first, hype never.” And honestly, the data suggests that the “feel” of the market is exactly what leads most traders into the slaughterhouse.
Expert: Well, I’m listening, but I’ll tell you right now, if you start throwing Greek letters at me without explaining how it actually puts USDC in my wallet, I’m going to push back. At the end of the day, 40% returns are 40% returns. I don’t care if a robot made them or a monkey throwing darts made them. Green is green.
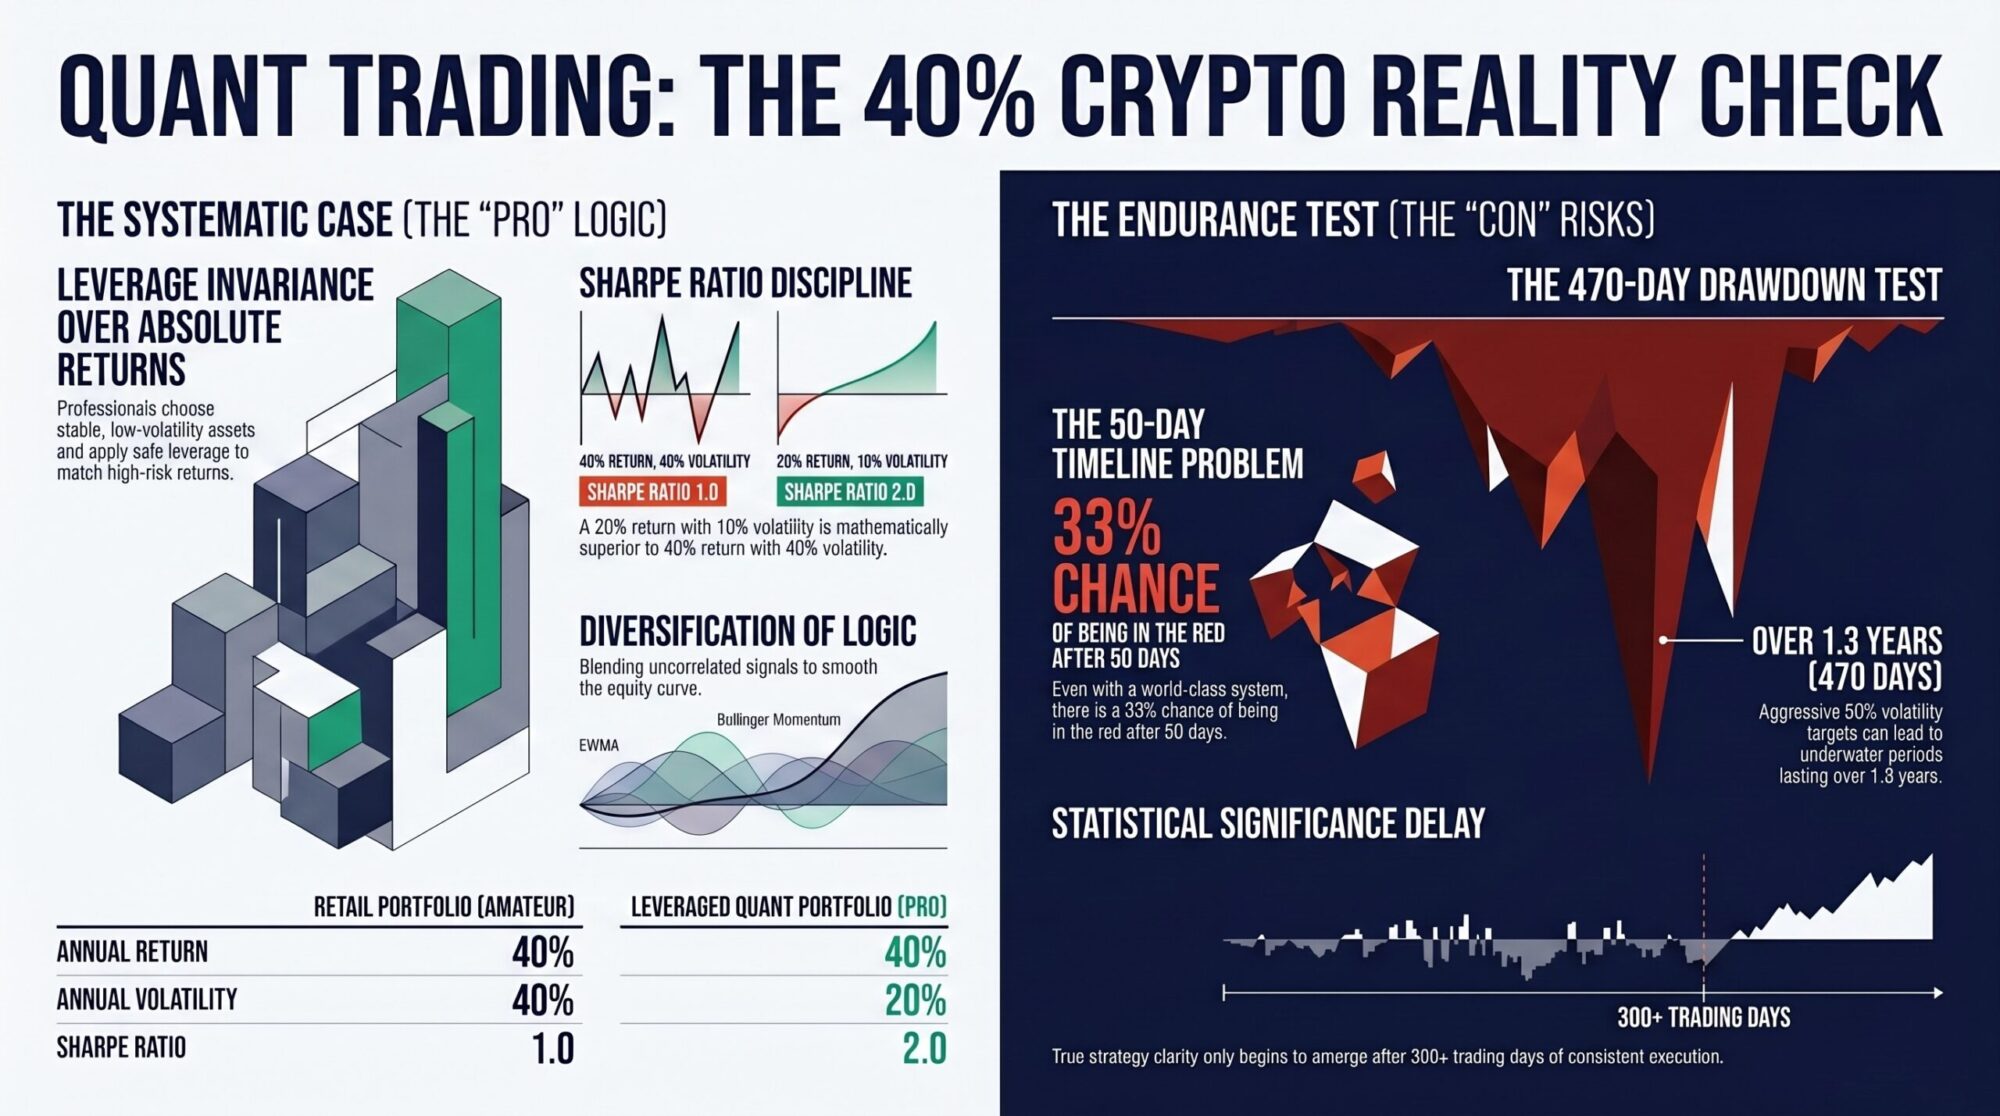
Host: You know that statement right there, “green is green.” That is the perfect place for us to start because that belief, that’s the first trap. Let me ask you a question and it comes directly from the research. It’s a simple choice. I offer you two investments. Investment A gives you 40% annual returns with 40% annualized volatility. Investment B gives you 20% annual returns, 10% annualized volatility. Which one do you take?
Expert: I mean, if I’m looking at my P&L at the end of the year, obviously investment A. It’s double the money. 40% is better than 20%. Why would I willingly take half the profit? This is crypto. We’re here for the asymmetric upside, not bond yields.
Host: And that is the amateur mistake. And I don’t say that to be insulting, but that is the literal definition of how a retail trader sees the market versus how a quant sees it. You chose absolute returns. A professional chooses leverage-invariant performance.
Expert: Leverage invariant. Okay, you’re going to have to unpack that one for me. That sounds like textbook jargon.
Host: It comes down to something called the Sharpe ratio. It’s just the measure of your return per unit of risk. So look at the math of your choice. Investment A, that’s 40% return divided by 40% volatility. That’s a Sharpe ratio of 1.0. That essentially means for every unit of reward you wanted, you had to accept one unit of risk.
Expert: Mhm.
Host: Now look at investment B. The 20% return divided by 10% volatility. That is a Sharpe ratio of 2.0.
Expert: Okay, so the score is higher on the second one. Great. But I still have less money in my bank account with investment B. You can’t spend a Sharpe ratio at the grocery store.
Host: Only if you don’t use leverage. And this is the secret mechanism of the hedge fund world. Because investment B is so stable, because its volatility is so low, I can apply 2x leverage to it safely. Now, my 20% returns become 40% returns, matching your investment A. But here’s the kicker. My volatility only goes from 10% to 20%.
Expert: Wait, so you’re telling me you’re matching my returns, but you’re taking half the risk?
Host: Exactly. I have matched your 40% return, but I have half the likelihood of a drawdown. When the market crashes, you wipe out because your volatility is just out of control. I survive. That is leverage invariance. You aren’t beating the market if you’re taking more risk than the market to get your returns; you’re just gambling with a bigger shovel.
Expert: That’s a really compelling point. So, the goal isn’t just “number go up,” it’s “number go up smoothly.”
Host: Precisely. Volatility is the enemy of compounding. If you lose 50%, you need a 100% gain just to get back to even. That’s the math that kills retail portfolios. And let’s look at the actual data. Bitcoin’s 10-year Sharpe ratio is about 0.81, which is actually quite poor. For every unit of return, you are suffering a massive amount of volatility.
Expert: Huh. I guess that explains the ulcers I get holding BTC.
Host: It really does. It’s a wild ride. I mean, even Warren Buffett, a genius stock picker, has a Sharpe of roughly 0.76. His path is rocky. He just endures it longer than anyone else. Now, compare that to Renaissance Technologies Medallion Fund, the absolute gold standard. Their Sharpe is roughly 2.5. They are printing money with almost no variance. So strategies like HyperTrend target a conservative Sharpe of 1.5. That’s the difference between gambling and systematic wealth extraction.
Expert: Okay, I get the logic. If the ride is smoother, you could bet bigger without blowing up. That makes sense. But here is my issue with these so-called systems. You talk about the long-term and smoothing out the curve, but I’ve tried these bots before. I sign up. I put in my ETH, and for 2 months, it does absolutely nothing, or worse, it loses 5% while the market is flat. I mean, if a bot is losing money for 2 months, my retail intuition tells me it’s broken. I’m cutting my losses.
Host: And that reaction is exactly why the hedge funds have your money. This is what we call the timeline problem. And we have to look at the statistical reality of performance variance. The research here is brutal. Even with a world-class system, and I’m talking a true 1.5 Sharpe ratio better than 95% of hedge funds, after 50 trading days, your results are mostly noise.
Expert: 50 days? That’s almost 2 months. You’re telling me 2 months of trading data is meaningless?
Host: Statistically, yes. At 50 days, there’s only a 58% probability you’re even in the green. Meaning there’s a 42% chance you’re red even though the system has a genuine edge. At 100 days, it gets better. You’re at 68% probability of profit. But to reach 95% confidence that the system actually works, you need 400 days.
Expert: 400 days. That’s over a year. Most retail traders quit after a bad week.
Host: Exactly. And that’s the evolutionary filter. The quants know they need 12 to 18 months of data to judge a strategy. Retail sees three red days and calls it a scam. This is the timeline problem. You’re evaluating a marathon runner after the first hundred meters.
Expert: Okay, so patience is part of the edge. I get that. But what about the actual signals? You keep saying “the system works,” but what is it actually doing? Is it just buying when RSI is oversold?
Host: God, no. That’s a single indicator. Single indicators are fragile. They work until they don’t. HyperTrend uses a blend of six uncorrelated signals. Think of it as a diversified portfolio, but instead of diversifying assets, you’re diversifying logic.
Expert: Walk me through them. What are the six?
Host: Signal one is classic trend following. Simple moving average crossovers. If the 50-day crosses above the 200-day, you’re long. It’s boring, but it works over decades.
Expert: That’s the turtle traders’ bread and butter.
Host: Exactly. Signal two is breakout systems. Nick Radge’s methodology. If Bitcoin breaks above its 10-day high, that’s momentum. You ride it.
Expert: Okay, so far these are just standard technical analysis.
Host: Exactly. Signal three is breakouts, looking at 10-day highs versus 320-day highs. Again, capturing trends at different speeds. But then we get into the more sophisticated stuff. Signal four is the floor-ceiling regime detection developed by Laurent Bernut.
Expert: Regime detection. That sounds like politics.
Host: It identifies whether the market is trending or ranging. Most bots lose money because they try to trend follow in a sideways market. This signal acts as a filter. It tells the system, “Hey, the water’s choppy. Stop trying to surf.”
Expert: Okay, that I like. Determining if we are chopping or trending is the hardest part of trading. I get chopped up in the sideways months all the time. Buying the breakout that immediately retraces.
Host: Signal five is normalized momentum, which is based on Bob Carver’s methodology. It smooths the price data before calculating momentum to remove the noise. And signal six is a variation of MACD used by MAN AHL, focusing on long-term convergence.
Expert: So you take these six things, and you just average them out.
Host: You blend them based on their correlation. The math here is beautiful. A single signal might have a Sharpe of 1.2, but because these signals are uncorrelated, meaning the breakout signal might be firing while the floor-ceiling is neutral, when you combine them, you smooth out the equity curve. The combined Sharpe pushes towards 1.8. It’s diversification not of assets, but of logic.
Expert: Diversification of logic. I’ll admit that sounds smarter than yoloing into a coin because I saw a green candle. But let’s talk execution. You mentioned Hyperliquid. Does it really matter where I trade? Binance, Bybit, on-chain. I mean, fees are fees, right?
Host: Wrong. Fees and slippage are the silent killers of compounding. The source material highlights this heavily. We’re seeing a move to infrastructure like Hyperliquid, which offers semi-HFT, high-frequency trading execution speeds. We’re talking about 15 to 20% better execution efficiency.
Expert: 15%. That sounds high. How does speed save me 15%?
Host: It’s not just speed. It’s the cost of crossing the spread. It’s the funding rates. It all compounds. If you’re saving a few basis points on every single trade and you’re trading systematically over 300 days, that efficiency is the difference between a good year and a great year. It lets the system trade faster signals that would be unprofitable on a slower, more expensive exchange.
Expert: Okay, so you’ve got the math, the signals, and the fast exchange. But here’s the question every retail trader really struggles with, and I struggle with it, too. How much do I bet? I usually just do like 5% of my account per trade, or if I’m feeling confident, maybe 20%.
Host: And that is completely arbitrary. Why 5%, why not 4.2? Why not 8? The Trader Army uses the Kelly criterion. It is the only mathematically optimal position sizing strategy.
Expert: I’ve heard of Kelly. Isn’t that the old gambling formula?
Host: It is. It calculates the exact bet size to maximize geometric growth based on your edge and your odds. But here’s the catch, the Kelly curve. Imagine a hill. As you bet more, you climb the hill, and your returns go up. But there is a peak. If you bet past that optimal point, you go right over the cliff. Your returns actually decrease while your risk explodes.
Expert: So betting more can actually make you less money. That doesn’t feel intuitive. If I win, I should win more.
Host: But if you lose, the hole you’re in is that much deeper. And because of that volatility drag we talked about, you just can’t climb out. Betting too big guarantees ruin. More isn’t better. In our context, we translate Kelly into volatility targeting. The system adjusts its position size dynamically to keep the portfolio’s volatility at a specific target.
Expert: Okay, break down the targets for me. If I sign up for HyperTrend, what are my settings?
Host: We generally look at three tiers. There’s 25% volatility, which is balanced, moderate returns, and acceptable drawdowns. This is the hedge fund standard. Then there’s the aggressive target at 50% volatility.
Expert: 50% sounds like a lot.
Host: It is. That’s what the founder of FINREV runs. It is technically the optimal growth point, but and this is a massive but, it is psychologically brutal.
Expert: How brutal? Give me the worst-case scenario. Don’t sugarcoat it.
Host: We ran Monte Carlo simulations, 10,000 paths with a 50% volatility target. The best-case scenario is incredible. 124% annual returns. But the worst-case path, you’re looking at a 53% drawdown.
Expert: Ouch. 53%. So my account gets cut in half.
Host: And that’s not even the worst part. The duration of that drawdown was 470 days.
Expert: Wait, wait. Stop. 470 days. You expect me to just sit in a drawdown losing money or being underwater for a year and a half?
Host: That is the price of admission for optimal geometric growth. If you want the 124% upside, you have to be able to survive the 470-day valley of death. This is why we say “research first, hype never.” If you don’t understand the math, you will quit on day 200. You’ll take the loss, call the system a scam, and leave right before the recovery spikes you back to all-time highs.
Expert: That really puts things in perspective. I look at my own trading history, and yeah, I usually quit a strategy after a bad month. I can’t imaging holding through a bad year.
Host: And that is why hedge funds win. They have institutional mandates that force them to stick to the math. Retail traders have emotions. The gap between the amateur and the pro isn’t magic. It is the discipline to trust the math over the emotion, even when it hurts. Especially when it hurts.
Expert: You know, I came into this thinking you were going to try and sell me on some magic money printer. But you’re actually selling me pain. You’re telling me it’s going to be boring. It might lose money for months, and I have to just sit there and take it because a spreadsheet says so.
Host: I’m selling you clarity. From chaos to clarity. The market is in chaos. You can’t predict the next tick. But you can predict the statistical outcome of a thousand ticks if your edge is real. The pain you feel during a drawdown is just the cost of buying that long-term certainty.
Expert: I have to admit the logic holds up. I’m still intimidated by that 470-day number. I think I’d probably stick to the 25% volatility target so I could actually sleep at night. But I see now why raw returns are a trap. If I’m making 40% but swinging 50% down to get there, I’m just gambling. I’m just one bad coin flip away from going to zero.
Host: Exactly. With a high Sharpe ratio, you’re building a fortress. You’re designing a system that can survive the winter so it can feast in the summer.
“For the statistical detail behind the potential 470-day drawdown reality discussed in this episode — including the Monte Carlo distribution tables — read the full analysis is in the pillar 02 article.”
Article 02 Why Crypto Trading With Hedge Funds Returns 40%+
Expert: It’s funny. I used to think the Trader Army guys were just nerds who didn’t get the culture of crypto. But hearing you explain the signal blending, it’s not that you ignore the culture, it’s that you quantify it. You’re measuring the FOMO with Bollinger bands and the trend with breakouts. You’re just putting a number on human greed and fear.
Host: We are quantifying human behavior. Prices are just the aggregate psychology of the market, and psychology repeats. That is why these signals have worked for a century. From wheat futures in the 1900s to Bitcoin today, the assets change, but the fear and greed remain constant.
Expert: Well, you’ve given me a lot to think about. I think I need to stop chasing the 100x gems and start looking at my portfolio like a marine ecosystem. Though I might need a stiff drink before I turn on a 50% volatility target.
Host: Start conservative. Let the math prove itself. The goal is to stay in the game long enough for the law of large numbers to work in your favour.
Expert: Fair enough. Survive the variance, right?
Host: Survive the variance to capture the drift.
Expert: I like that. All right, I think that wraps it up for today. This has been the debate.
Host: Thanks for listening. Keep your head in the data, not the hype.
Key Takeaways
- Leverage-Invariant Performance Beats Raw Returns – A 20% return with 10% volatility (Sharpe 2.0) beats 40% with 40% volatility (Sharpe 1.0) because you can apply 2x leverage safely, matching returns while halving risk.
- The Timeline Problem Kills Retail Traders – Even with a 1.5 Sharpe system, 50 days = 58% probability of profit, 100 days = 68%, 400 days = 95%. Most retailers quit after bad weeks, never reaching statistical significance.
- Six Uncorrelated Signals Create 1.8 Sharpe – Blending trend following, breakouts, regime detection, normalized momentum, and MACD variations smooths equity curves through signal diversification, not asset diversification.
- Kelly Criterion Prevents Over-Betting – Betting past the optimal point (the peak of the Kelly curve) decreases returns while exploding risk. Volatility targeting implements Kelly dynamically.
- 50% Volatility Target: 124% Best Case, 470-Day Worst Drawdown – Optimal growth requires surviving 53% drawdowns lasting over a year. Most retail traders quit by day 200, right before recovery.
- 15-20% Execution Efficiency from Infrastructure – Hyperliquid’s semi-HFT speeds and reduced fees compound across 300+ trading days, turning unprofitable signals profitable through basis point savings.
📖 Read the Full Article: Why Crypto Trading With Hedge Funds Returns 40%+ While Retail Traders Struggle: The Math They Don’t Want You to Know
🎯 Ready to Think Like a Quant?
The gap between 40% hedge fund returns and zero retail returns isn’t insider knowledge — it’s mathematical discipline surviving the timeline problem.
Next Step: Watch the introduction video to understand how Sharpe ratios and leverage invariance create systematic edges, the six-signal blend and regime detection filters, and why 400 days of data is the minimum evaluation period.
Understand this is a 5-10 year wealth-building journey, not a get-rich-quick scheme. The 470-day drawdown scenario is rare but very real — if you can’t psychologically handle it, trend following will torture you.
Resources Mentioned
- Sharpe Ratio – Risk-adjusted return metric (Renaissance 2.5, HyperTrend 1.5, Bitcoin 0.81, Buffett 0.76)
- Timeline Problem – Statistical reality that 50 days = mostly noise, 400 days = 95% confidence
- Six-Signal Blend – Trend following, breakouts (Nick Radge), regime detection (Laurent Bernut), normalized momentum (Bob Carver), MACD (MAN AHL)
- Kelly Criterion – Mathematically optimal position sizing avoiding over-betting cliff
- Volatility Targeting – Dynamic position sizing maintaining 25% (conservative) or 50% (aggressive) portfolio volatility
- Monte Carlo Simulations – 10,000 paths showing 124% best case, 53% drawdown, 470-day worst duration
- Hyperliquid – Semi-HFT infrastructure providing 15-20% execution efficiency gains
About This Podcast
This episode breaks down the mathematical frameworks separating professional quant funds from retail traders. For investors frustrated by inconsistent results despite “feeling” the market, understanding leverage invariance, the timeline problem, and signal diversification reveals why systematic discipline beats intuition.
Related Articles:
- Why Crypto Hedge Funds Make 40%+ While Retail Traders Struggle
- The Math Behind the Moonshots: Professional Research in Automated Crypto Trading
- Retail Trading Mistakes That Pros Exploit
Transcript generated from Notebook LM podcast discussion. Edited for clarity and formatted for web publication.